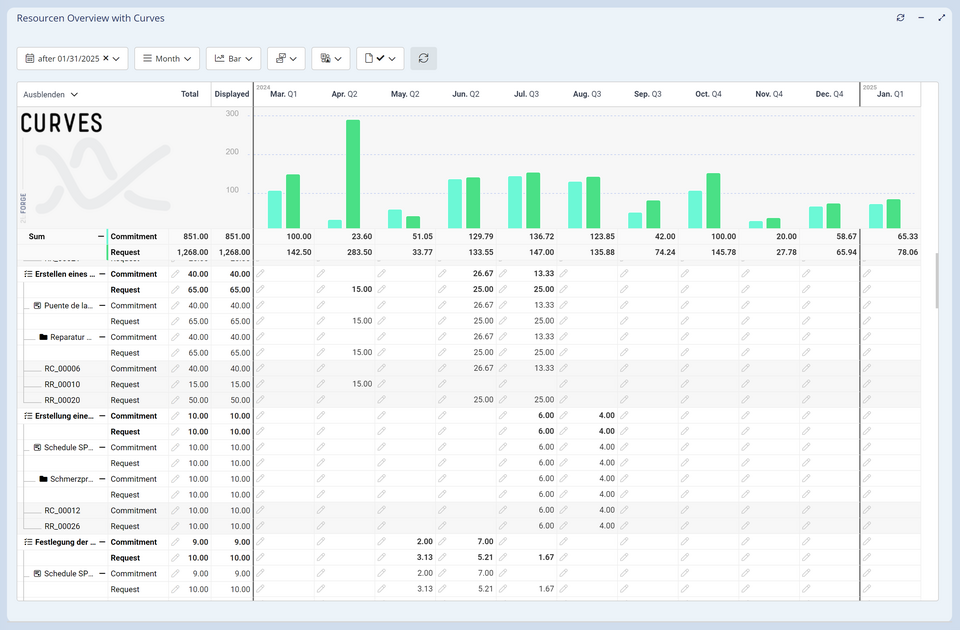
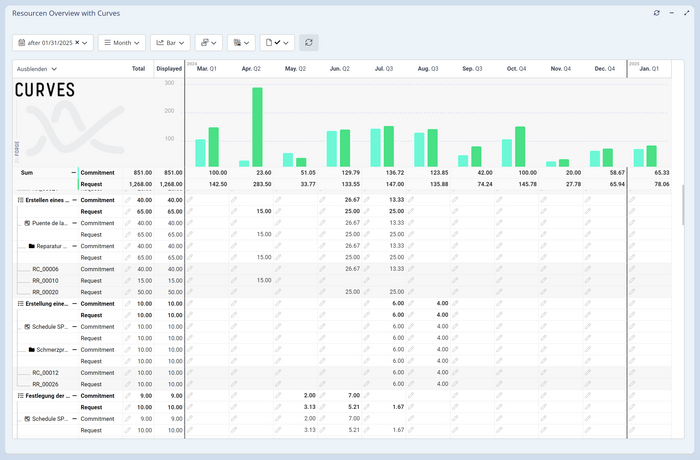
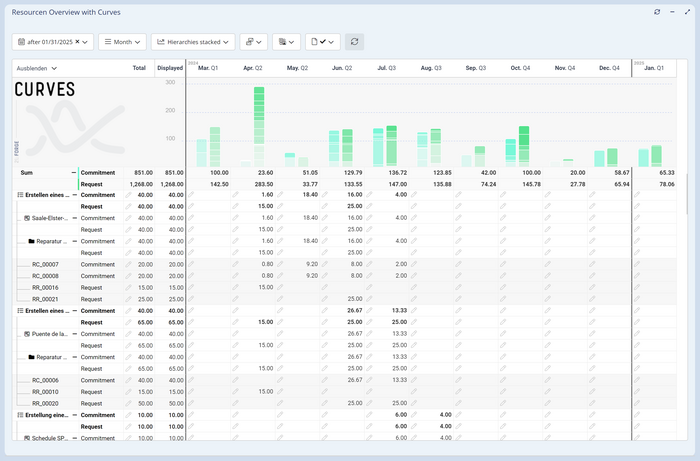
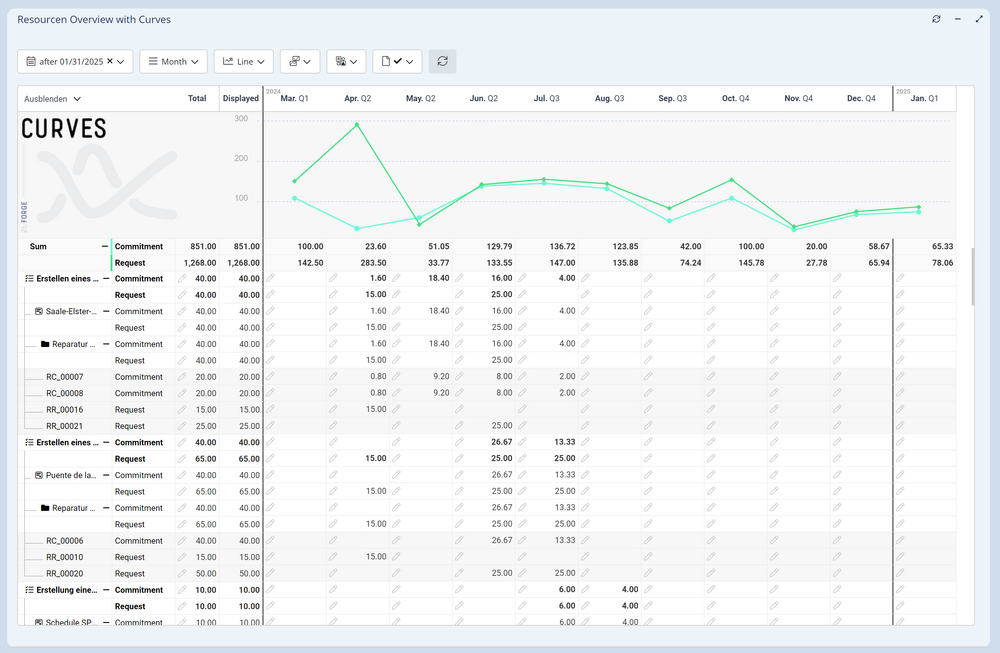
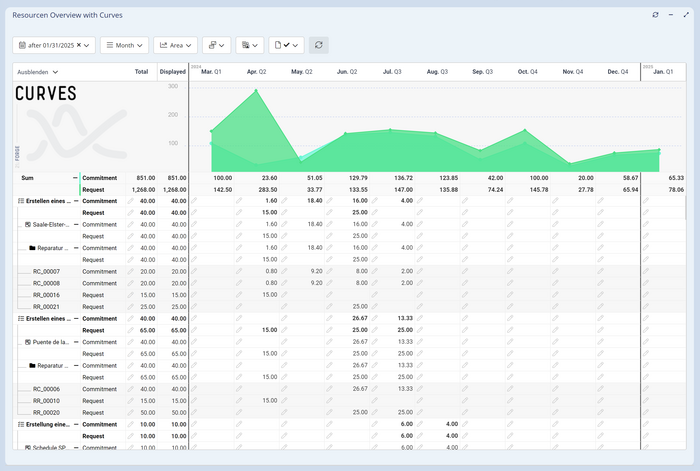
In day-to-day project routine, the precise planning of costs, resources, capacities or other numerical planned values is a fundamental prerequisite for project success. CURVES is an innovative cplace application that enables all project participants to analyze past values, forecast future ones and thus maintain an overview of the current situation at all times.
CURVES offers the necessary flexibility to clearly display various project information with different time scales in a combined evaluation. The versatile curves-widget is flexibly configurable. Time-based values can be displayed and edited graphically and in tabular form. The displayed information can be grouped and aggregated according to any attributes on an individually customizable timeline. This results in easily understandable diagrams and graphics from the raw data, which facilitates the interpretation and presentation of complex data. Data can be filtered easily and filter adjustments are displayed immediately.
With the integrated API, calculated data from CURVES can be exported and further processed in third-party apps.

